The impact of the Covid-19 pandemic on the global economy has been profound, especially in emerging, low-income economies with limited health care capacity.
Hopes of a V-shaped recovery faded in July as Covid19 cases worldwide ticked over 15 million. However, policy settings remain incredibly favourable as central banks and governments support economies via monetary easing and fiscal measures.
Cyclical indicators remain weak but are showing signs of improvement as the global economy adapts to the pandemic—global PMI’s for manufacturing and services moving back above 50 for the first time since January.
Australia
In Australia, the government warned that the economy likely shrunk at its fastest pace in recorded history in the June quarter, while the budget deficit will be the biggest since World War II. Unemployment rose to 7.1%, the highest level since late 1998, and the federal government announced a $15.6 billion expansion of the JobKeeper program, with Victoria estimated to receive $13 billion.
The resurgence in Coronavirus cases over the last month and the deteriorating situation in Victoria have rocked consumer sentiment. The Westpac-Melbourne Institute Index of Consumer Sentiment fell to 87.9 in July from 93.7 in June, reversing the impressive gains made in the previous month. The ‘economy, next 12 months’ sub-index recorded the most significant decline, slumping 14% in July to be 25% below pre-COVID levels.
Harsher lockdowns in Victoria will reduce GDP by between $7 billion and $9 billion in the September quarter, while the total hit to GDP is forecast to be around $12 billion. The recovery will be gradual and highly contingent on how the pandemic evolves.
The June quarter CPI release reported a 1.9% fall in consumer prices (versus -2.0% expected), the largest recorded fall in the index’s 72-year history. The quarterly fall was driven mainly by plunging childcare (-95.0%), slumping automotive fuel prices (-19.3%), and a fall in pre-school and primary education (-16.2%).
Retail sales rose slightly more than expected in June, gaining 2.7% (versus 2.4% expected) and following on from the 16.9% increase in the month prior. Cafes and restaurants saw the most significant recovery over the month, rising 27.9%, but department stores are still feeling the pinch, falling 12.1%.
The trade surplus increased from a downwardly revised $7.34 billion in May to $8.20 billion in June, less than the $8.80 billion surplus expected. Exports rose more than imports, increasing by 3.0% and 1.0%, respectively.
The AIG Manufacturing PMI moved further into positive territory, lifting 2.0 points to 53.5 in July. The two largest manufacturing sectors, food & beverage and machinery & equipment, drove the expansion in July. All other areas are reporting challenging trading conditions due to the impact of Covid19 and the underlying weakness of residential construction.
United States
The impact of the coronavirus caused GDP in the United States to shrink by an annualised 32.9% in the June quarter (-9.5% quarter-on-quarter).
Contractions were seen almost everywhere, particularly in personal consumption and exports, while federal government spending jumped. The recovery in consumer confidence faltered in July, slipping from 98.3 to 92.6.
The July ISM Manufacturing PMI increased to 54.2 from 52.6 in the previous, ahead of the expected 53.6, and the more forward-looking orders component of the report jumped 5.2 from the prior month, a sign that the positive momentum may continue for manufacturing.
US unemployment stood at 10.8% in July. Despite adding 9.3 million jobs over the past three months, total employment remains 12.9 million below its February level, and economists fear that some job losses may prove permanent. The July report comes on the heels rising COVID-19 cases across the Sunbelt region of the United States.
Because of the date of the survey, it may not fully reflect the economic impact of some of the more recent high-frequency data that has captured some of the effects of rising cases.
Europe
Across the Atlantic, EU leaders have been relatively successful in containing the Covid19 virus and providing much-needed fiscal support. In July the European Council approved a €750 billion package to fund budgetary transfers between member states. Since March, the euro has been on the rise against the US dollar as investors see European assets as increasingly attractive.
Europe is still under threat from a second wave of Covid-19 infections, with the French government describing the situation as “under control but fragile”. At the same time, Britain’s health secretary said, “I think you can see a second wave starting to roll across Europe, and we’ve got to do everything we can to prevent it from reaching these shores.”
The flash estimate for Eurozone June quarter GDP came in as expected, falling 12.1%, making it the largest contraction on record as lockdowns continued to impact global demand. France, Italy and Spain each reported double-digit falls in Q2 GDP.
In Germany, GDP for the June quarter fell 10.1%, taking the year-on-year rate to -11.7%. Incredibly, Germany’s unemployment rate held steady at 6.4%, with a surprise jump in the employment of 18,000. In signs of lockdown fatigue, around 17,000 people marched through the streets of Berlin to protest restrictions and mask-wearing. Meanwhile, EasyJet announced it would schedule additional flights to meet better than expected demand during the European summer.
Inflation remained subdued, with the yearly rate at 0.4%, slightly above the 0.2% expected. In positive news, the July Markit composite PMI printed at 54.8 in July, ahead of expectations of 51.1, with both manufacturing and services returning to growth as more businesses began reopening.
China
China’s June quarter GDP came in above expectations, with the yearly rate increasing to 3.2% (2.5% expected), following a -6.8% reading in the previous quarter and becoming the first country to report growth since the beginning of the pandemic.
The Caixin Manufacturing PMI for July rose to 52.8, posting the third consecutive rise in factory activity as consumer demand continues to pick up following the impacts of the coronavirus.
Flooding in southern China has destroyed roads, property and farmland, and displaced millions of people from their homes. China’s Ministry of Emergency Management estimated the direct economic cost of the disaster is around $21 billion. Preliminary research indicates that the floods could shave 0.17% from China’s 2020 GDP.
Equities
The recovery in Australian shares was cut short in July amid reports of growing Covid-19 cases and anticipation of harsher restrictions in Victoria.
The S&P/ASX 200 Index gained 0.5% over the month, dragged down by the energy and health care sectors, while materials outperformed.
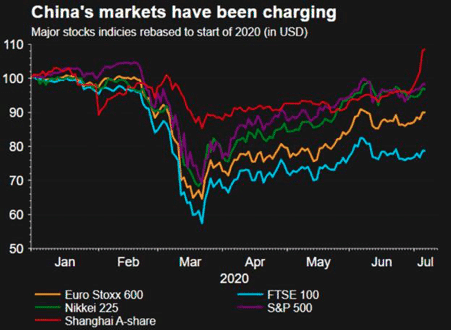
Global equities continued their March higher in July, rising 0.6% in Australian dollar terms and 3.5% in local currency terms. With around half of S&P 500 companies having reported at the time of writing, it is clear earnings have been severely affected by the pandemic. However, it has not been as severe as anticipated.
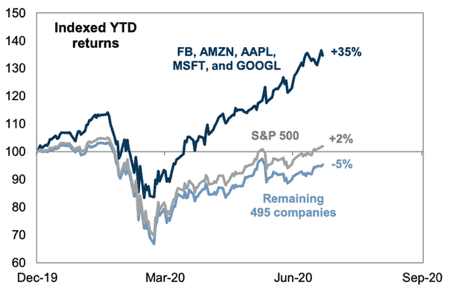
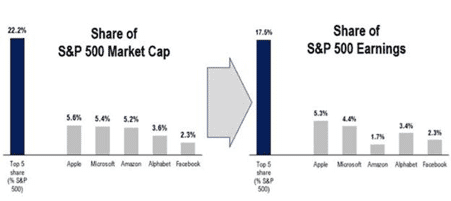
The ‘big four’ tech giants (Amazon, Apple, Facebook, and Google), have supported the US share market, with all beating earnings estimates. Adding Microsoft to this group, the five companies now represent approximately 22% of the S&P 500. However, they now represent more than 80% of 2020 earnings (per share) growth and 18% of earnings.
According to Credit Suisse, over the past 12 months the top five stocks in the index have grown revenues at 11.2% v just 0.8% for the rest of the S&P 500, and added more than $12 per share to the S&P 500 earnings per share number, while the rest of the index has subtracted c.$17.
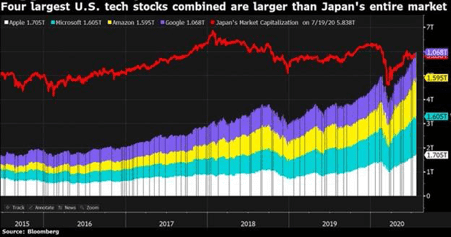
The net effect of the earnings and share price growth is that the value of the top four companies exceeds that of the entire Japanese stock market, which is the third-largest in the world behind the US and China.
Property
Australian REITs were mixed over July as the economic pain from the pandemic rolled on. Shopping centres, which play a prominent role in the A-REIT index, remain affected by reduced foot traffic and struggling tenants.
Scentre Group gave an update on its half-year results, noting that the carrying value of its property portfolio as at 30 June 2020 will be down approximately 10% from the end of 2019, with Covid-19 impacts the overriding reason.
Globally, developed market REITs returned 1.4% in Australian dollar hedged terms. In the US, single and multi-family residential held up better than expected due to the impact of stimulus measures on household income and savings rates, while commercial property continued to struggle.
Rates and Credit
July saw further compression in yields, and a tightening in spreads as central bank liquidity continued to flood the market.
In the US, the Fed intends to hold the funds rate near zero until the economy has weathered the pandemic. There is also growing acceptance that they will target an average inflation rate of 2%, rather than the absolute rate. That is to say, let inflation overshoot the 2% target before taking action.
While the 10-year Treasury yield has traded in a narrow range since early April, the equivalent real yield, as represented by inflation-protected Treasuries (TIPS) has continued to fall. While this may mean market expectations for growth are lower, it can also mean higher inflation expectations, with 10-year break-even rates well off their recent lows.
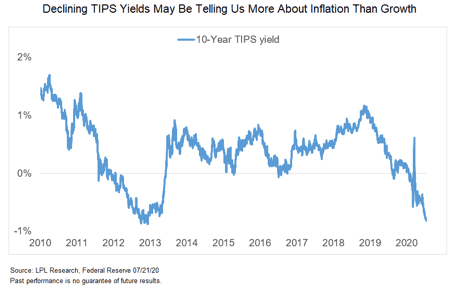
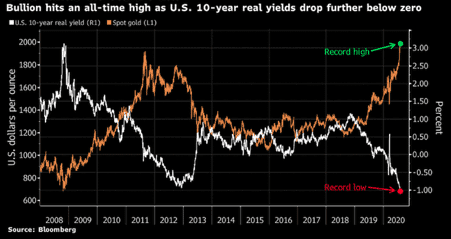
Negative real yields are being felt in other asset classes, particularly precious metals, and will have severe implications for savers. With an interest rate of 0.25% and an inflation rate of 3%, we are talking about a real interest rate of minus 3.25%.
Broad support from the Fed and a continuance in investors hunting for yield have helped to tighten spreads across both investment grade and high yield segments. The total return on US high yield corporate bonds was 4.7% in July in US dollar terms, the highest monthly gain since October 2011.
The Fed has been buying ‘fallen angels’, companies that have moved from investment grade to high yield, while the European Central Bank has been more targeted in its approach, resulting in higher levels of volatility in the euro high yield market.
Australian government bond markets have seen a solid increase in issuance, with the yield on 3-year government bonds broadly in line with the RBA’s 0.25% target. The yield target will remain in place until the RBA is satisfied it has brought the inflation and unemployment rates in line with its objectives.
Commodities
Oil prices rose through July, hitting five-month highs in early August following a substantial drop in US crude inventories, which fell by 7.4 million barrels in the week ending 31 July. The Brent spot price rose 3.6% to US$43.13 per barrel, and the WTI spot price 2.1% to US$40.10 per barrel.
Metals gained strongly over the month, with increases in Zinc (+13.2%), Nickel (+7.7%), Tin (+7.0%), Copper (+6.6%), Lead (+6.0%), and Aluminium (+5.8%).
With the continued collapse in real yields amidst inflation and geopolitical concerns, gold rallied 10.8% in July to US$1,975.86 per ounce and pushed above $2000 in early August. Ultra-low interest rates and a flood of stimulus programs by the world’s central banks and governments are also supporting demand from investors expecting an eventual rise in consumer prices that outpaces any interest-rate increases
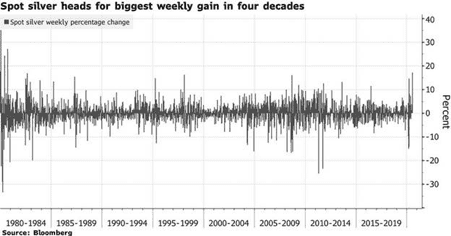
Silver also experienced its largest weekly move in almost four decades, as the gold:silver ratio reverted sharply from extreme levels.
FX
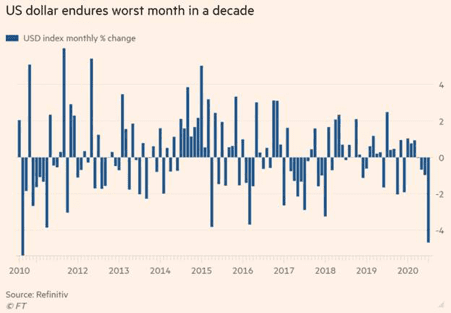
The Australian dollar continued its upward trend in July, appreciating 3.2% in trade-weighted terms and rising from US$0.69 to $0.72.
Ballooning twin deficits in the US and expectations that the Federal Reserve is taking a more relaxed view on inflation are both contributing to a weaker US currency. At the same time, Australia’s relative success in containing the pandemic has supported the Australian dollar.
This article contains information first published by Lonsec. Voted Australia’s #1 Research House for 2019.
General Advice Warning
The information on this website contains general information and does not take into account your personal objectives, financial situation or needs. You should consider whether the information and any general advice provided is appropriate for your personal circumstances and where uncertain, seek further professional advice before taking any action.
Important Information
Walbrook Wealth Management is a trading name of Barbacane Advisors Pty Ltd (ABN 32 626 694 139; AFSL No. 512465). Barbacane Advisors Pty Ltd is authorised to provide financial services and advice. We have based this communication on information from sources believed to be reliable at the time of its preparation. Despite our best efforts, no guarantee can be given that all information is accurate, reliable and complete. Any opinions expressed in this email are subject to change without notice, and we are not under any obligation to notify you with changes or updates to these opinions. To the extent permitted by law, we accept no liability for any loss or damage as a result of any reliance on this information.